
Young Adult Hoosiers Care—But Don’t Vote
Young adults in Indiana are engaged with the world around them, but many feel disconnected from the political process. They are:
Distrustful of government
Disappointed by politics
Impeded by Election Day barriers
About the Research
Indiana ranks among the lowest states in civic participation. Although young adults are the state’s second-largest age group, they consistently have the lowest voter turnout.
ReCenter Indiana’s nonpartisan research shows that non-voters ages 18–34 are not apathetic—they face real barriers to participation. Addressing these barriers presents a powerful opportunity to engage Indiana’s youngest voters in civic life.
ReCenter Indiana conducted:
A focus group with young adults, and
A survey of 307 Hoosier adults (ages 18–34) in Marion, Hamilton, and Boone counties who were registered to vote but did not participate in the 2024 election.
The survey sample was statistically significant, with representation across age, gender, location, and political affiliation. Two independent research firms jointly participated to ensure nonpartisan results.
KEY FINDINGS
They feel like the government isn’t listening to them.
Young adults overwhelmingly feel their voices and votes do not influence government actions or election outcomes.
How do you feel about the future of the country?
50% Pessimistic / Negative
27% Mixed
15% Optimistic / Positive
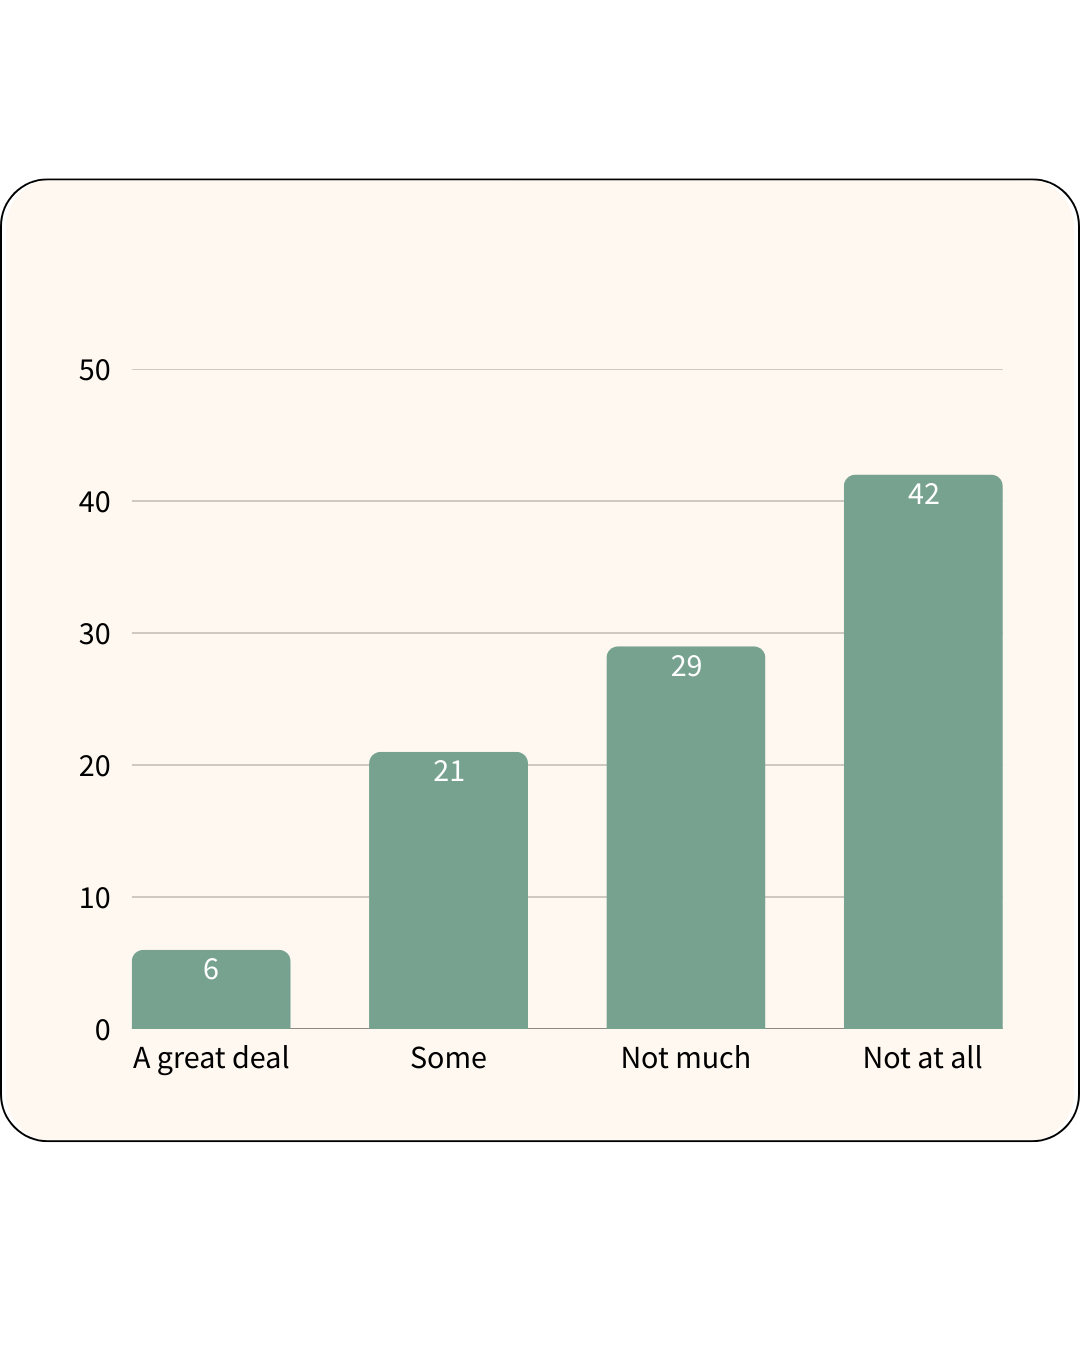
To what extent do you believe the votes of people like you influence the government’s actions?
There was no meaningful difference in outlook between those who have voted before and those who have never voted. Feeling that their vote doesn’t matter is the top reason young adults give for not voting. Disinterest was among the least-cited reasons.
“I think for the most part, the government can do things to fix certain issues, but I think the parties are more focused on stifling each other than coming up with a solution.”
— 20-year-old white man, Marion County
What turns them off from voting in general?
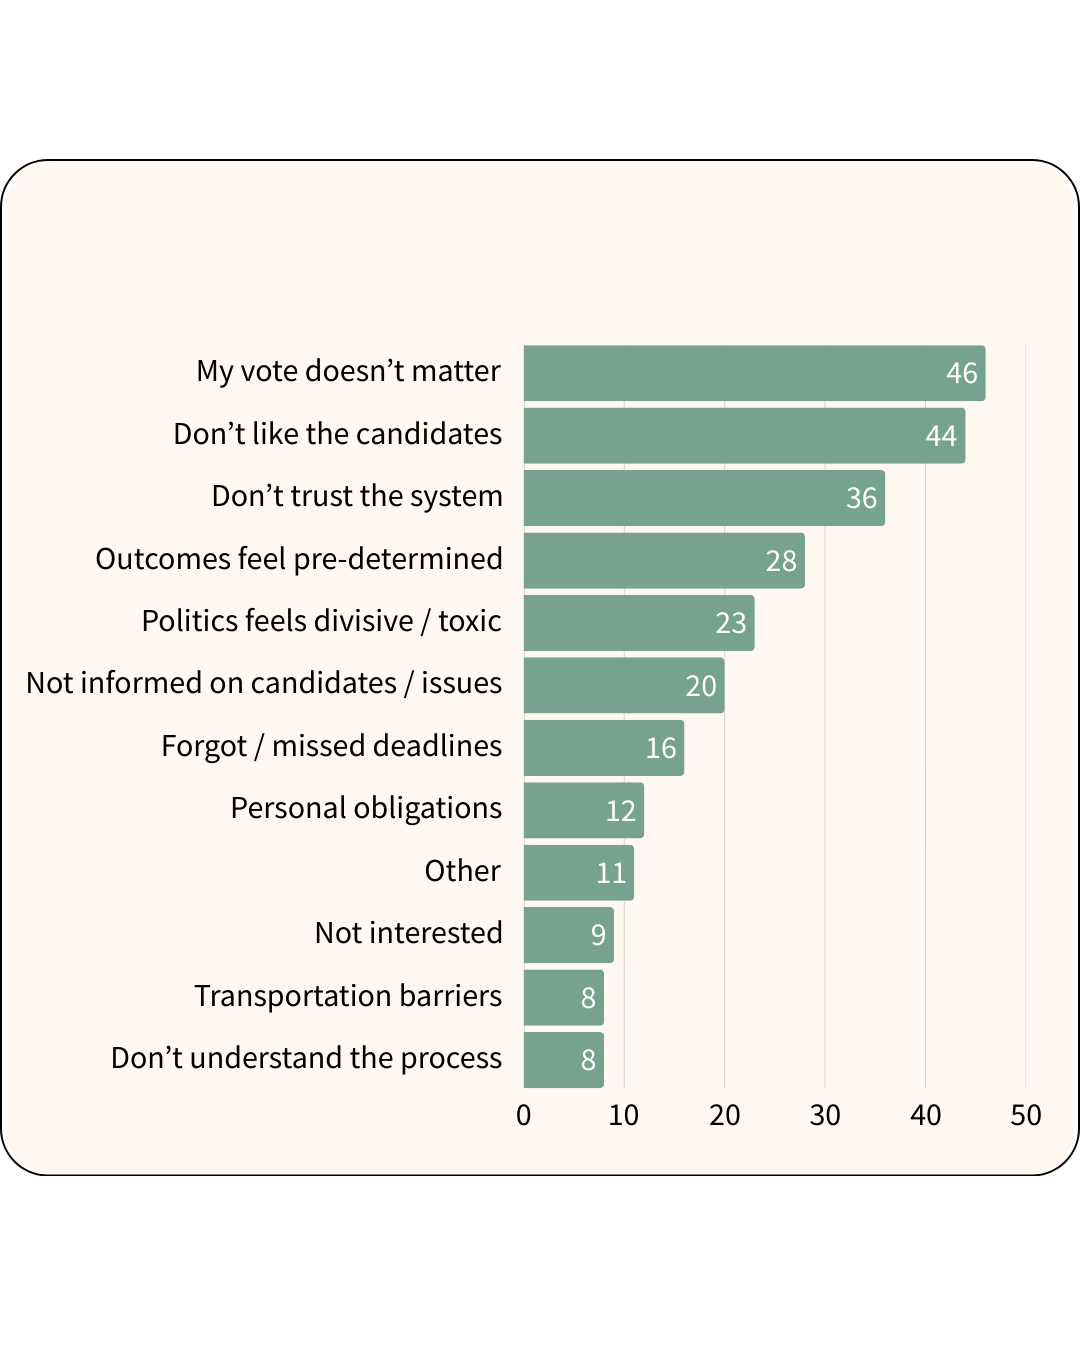
Which of the following make you less likely to vote?
While young adults share common frustrations, the specific barriers to voting differ by gender, race, and party.
Barriers differ by party
Independents: Not liking either candidate (24%)
Democrats: Didn’t think my vote mattered (21%)
Republicans: Forgot / missed the deadline (13%)
Barriers differ by identity
Women: Personal obligations
Men: Not liking either candidate
White voters: Not liking either candidate
Black voters: Personal obligations
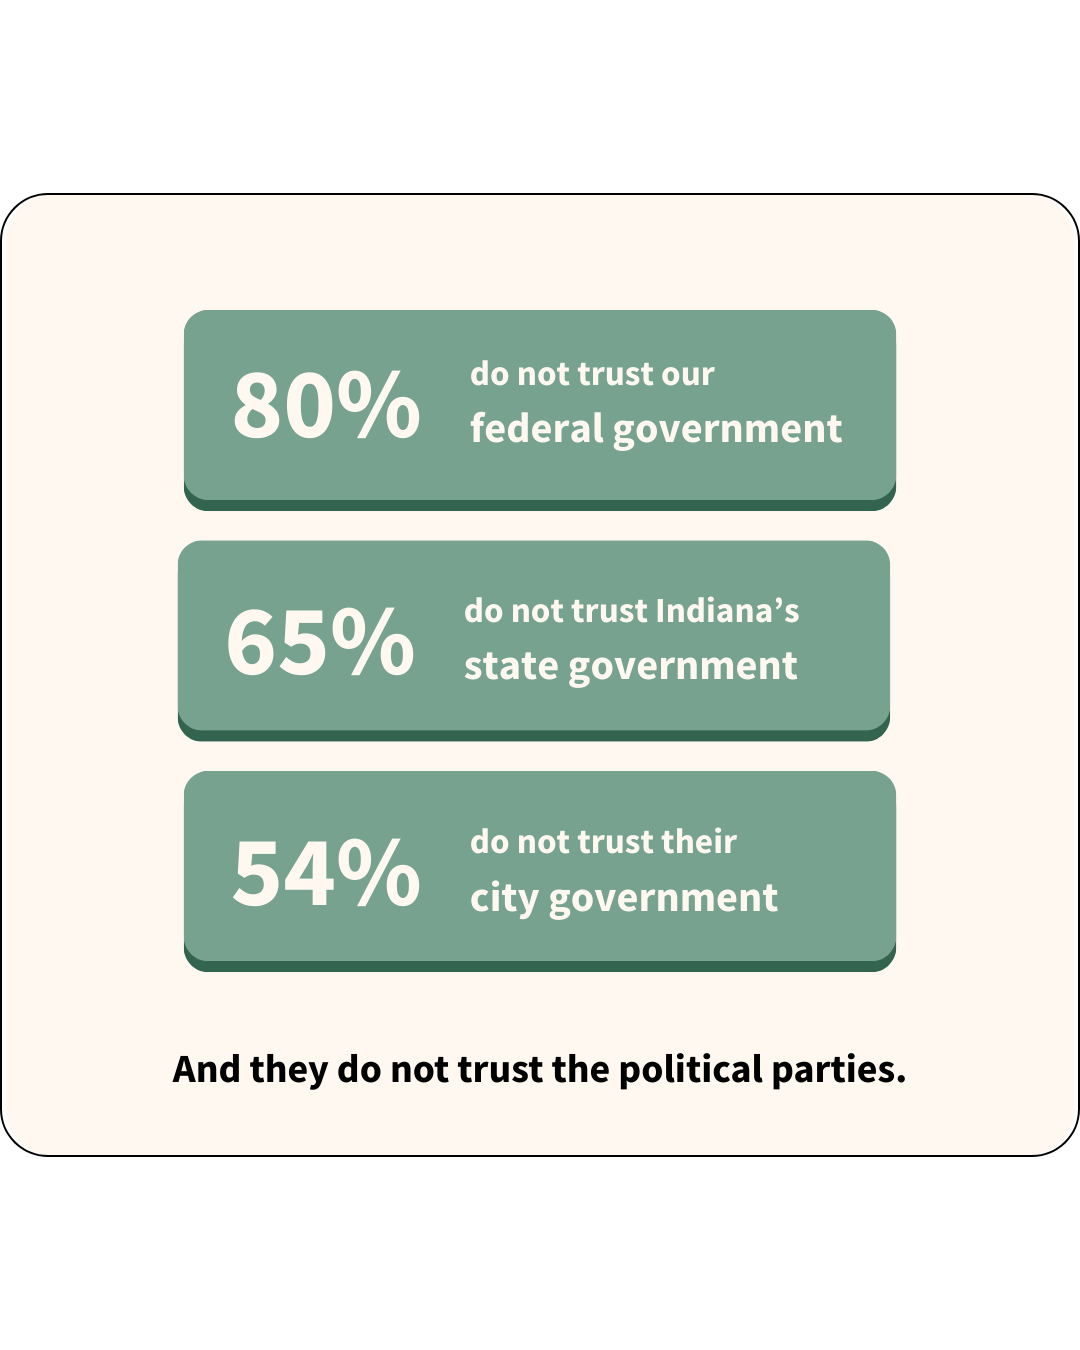
There is widespread distrust amongst young adults.
Those who have never voted were more likely than those who have voted to cite distrust of the process or lack of information. 45% of surveyed young adults have never voted.
A low-interest voter is typically:
Younger
More likely to be a person of color
Less likely to follow politics or identify with a party
Less likely to be surrounded by regular voters
Non-voters are less likely to vote for the first time in 2026 than intermittent or lapsed voters are to return.
Voices From Young Hoosiers
“I feel like a lot of things just don't make sense anymore. What type of world are we living in? I feel very angry about the decisions that are made, the people in government.”
— 18-year-old Black woman, Marion County
“A lot of times you like neither one of the candidates, and so it just feels like you have a
limited choice.”
— 20-year-old white man, Marion County
“I'm feeling pessimistic. The recent elections have kind of caused me to not feel like there's any upside to these elections.”
— 30-year-old Black man, Marion County
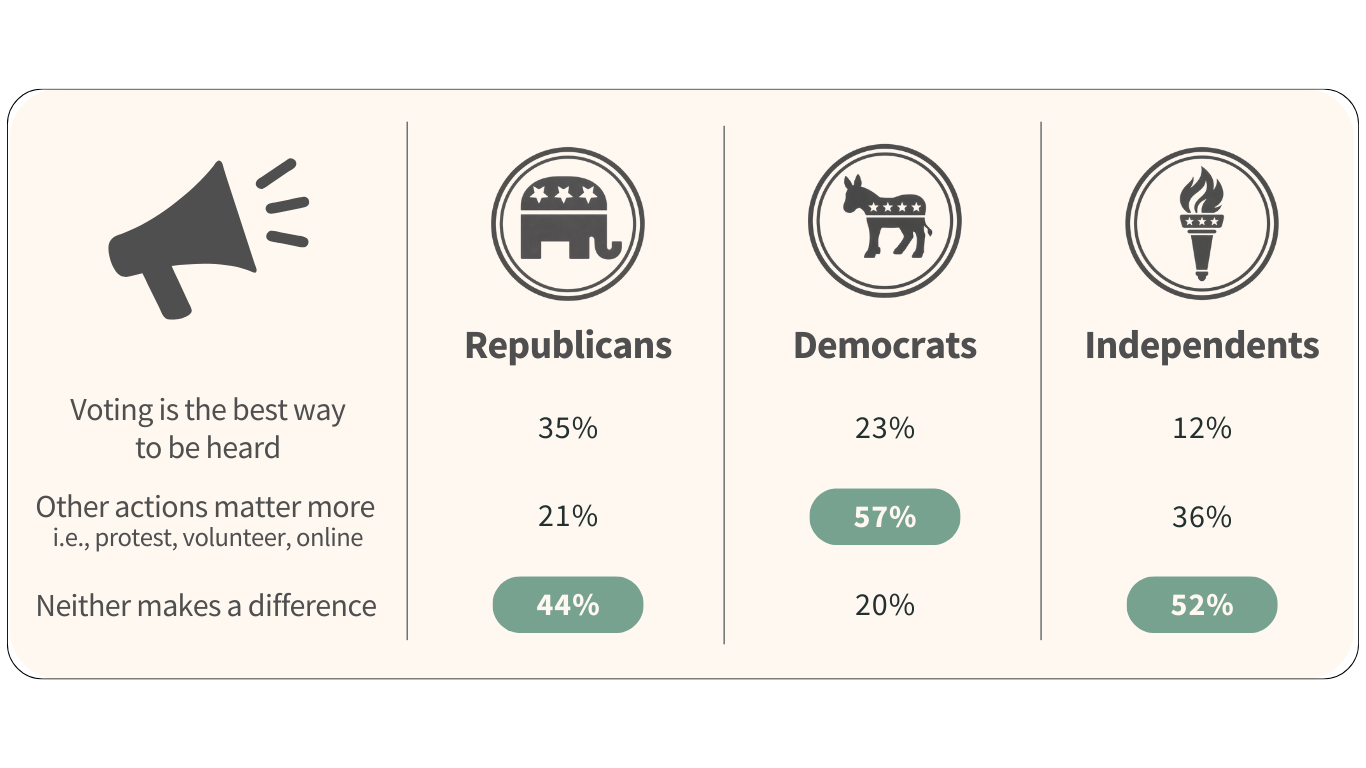
Voting is not valued as the best way to make their voice heard.
Many young adults DO want to vote.
When asked about voting in 2026:
35% said Definitely Yes
Another third rated themselves above average in likelihood
16% said Definitely No
Focus group participants viewed Election Day as the chance to vote—few mentioned early voting or other options. Most were uninterested in voting by mail, and if they were working or away on Election Day, they simply did not vote. They say that work, limited voting hours, and long lines are obstacles to voting.
Voting seems convenient, until it’s not.
What motivates young voters?
Candidates and convenience can make a difference for young adults.
Which of the following makes you more likely to
vote in the next election?
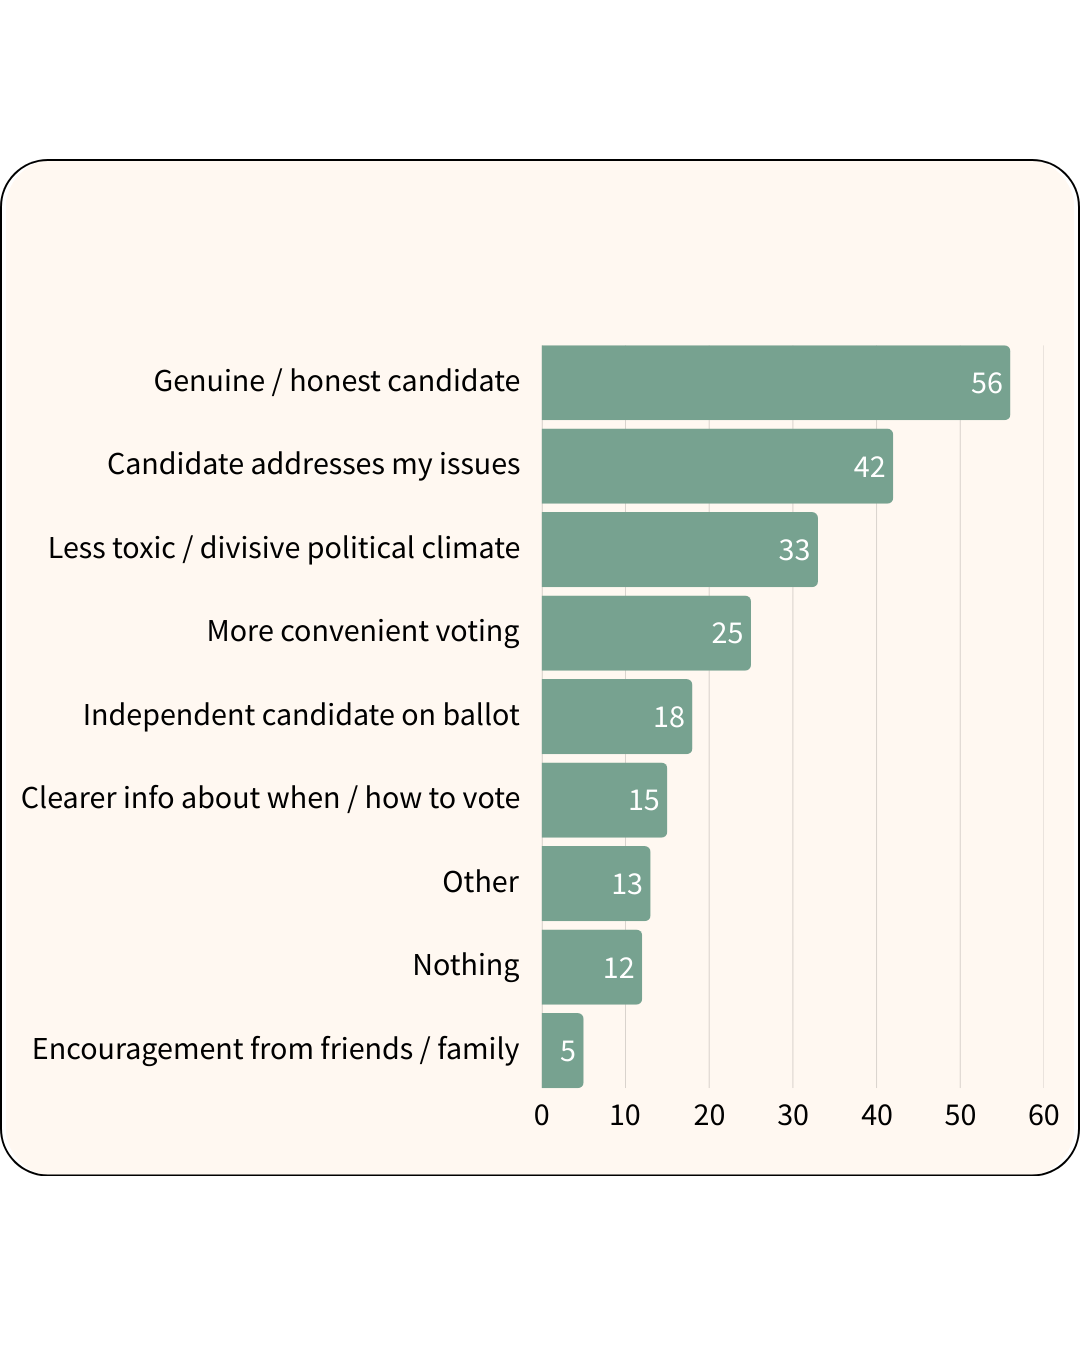
What motivates young adults to vote is clear: trust in candidates and ease of participation matter.
Respondents were most motivated by candidates who feel genuine, speak to issues they care about, and reduce the toxicity of politics. Practical improvements like more convenient voting options and clearer information can also increase engagement. Together, these findings show that when voting feels both meaningful and accessible, young adults are more likely to participate.
The top issue for young adults is affordability.
“We are stronger when we support each other—whether it is in our neighborhoods, in our workplaces, or in the voting booth, where we have the chance to vote for candidates who look out for our community.”
Top ranking statement:
— 79% of survey participants agreed
Survey Details
METHODOLOGY
This research study was funded by a grant awarded to ReCenter Indiana, Inc. by the Nicholas H. Noyes Jr. Memorial Foundation. The study was a joint project of Bellwether Research and Hart Research. Bellwether Research surveyed 307 young adults in Marion, Hamilton, and Boone counties who were registered to vote but did not participate in the 2024 election.
Field dates: October 26-29, 2025
Respondents were contacted by phone or texted a secure link to take the survey online
All references to a focus group or quotes are from an October 22, 2025, discussion convened by Hart Research with seven young adults who fit the survey respondent profile
The focus group discussion helped determine the final survey questions
Margin of error is +/- 5.6%
SNAPSHOT
51% Male | 49% Female
64% White | 22% Black | 5% Hispanic | 9% Other
60% Marion | 33% Hamilton | 7% Boone
19% ages 18–22 | 53% ages 23–29 | 28% ages 30–34
55% have voted before | 45% never voted
40% Democrat | 32% Republican | 28% Independent
RESOURCES